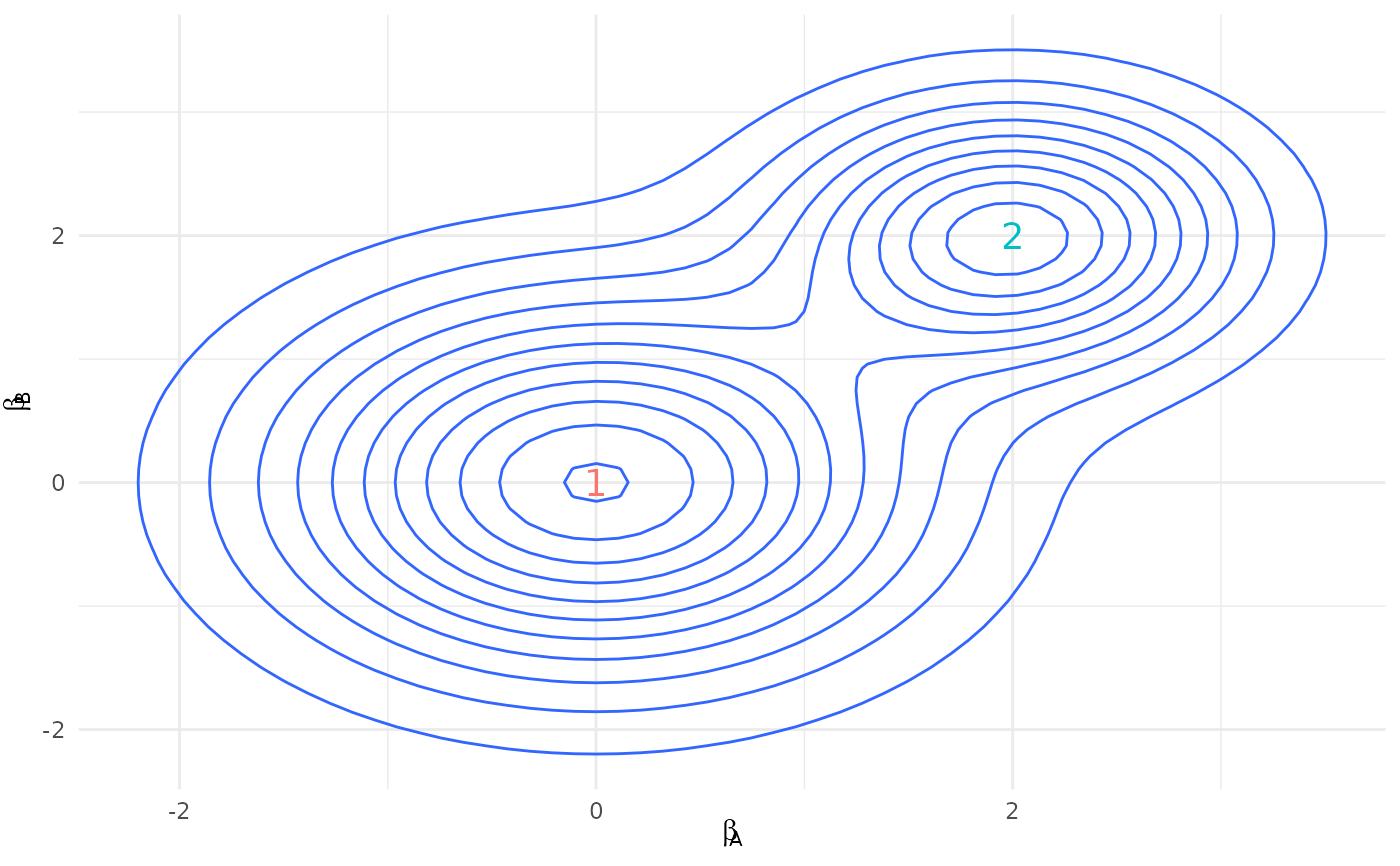
This function plots an estimated bivariate contour mixing distributions.
Usage
plot_mixture_contour(means, covs, weights, names)
Arguments
- means
The class means.
- covs
The class covariances.
- weights
The class weights.
- names
The covariate names.
Value
An object of class ggplot.
Examples
means <- list(c(0, 0), c(2, 2))
covs <- list(diag(2), 0.5 * diag(2))
weights <- c(0.7, 0.3)
names <- c("A", "B")
plot_mixture_contour(means, covs, weights, names)